Integrated Applications
Volt-var Optimization (VVO)
The sample VVO application is a Python implementation of a heuristic method that PNNL has investigated before [CIT3], [CIT4], [CIT5]. There are more advanced VVO methods that could be implemented in future applications.
Visualization
We have created a web-based visualization of the sample VVO application. The visualization displays the topology of the IEEE 8500-Node system as an interactive graph. Capacitors and regulators are highlighted in the graph and displayed alongside tables with current values for capacitor status (OPEN or CLOSED), regulator voltage, and feeder power.
PNNL Applications (Release Cycle 2)
State Estimator Service
Given a perfect and complete set of voltage magnitude and angle measurements, along with a detailed and accurate power system model, one could calculate the real power, or any other electrical variable of interest, anywhere in the system. In practice, measurements have errors, time delays, and may even be missing. State estimation refers to the process of minimizing the errors and filling in gaps [1]. One state estimation method is called “weighted least squares”, and it’s analogous to drawing the best-fit line through a set of scattered points. Other methods may perform better [2]. Also, on distribution systems, it may be better to estimate branch currents instead of node voltages, but the principle is the same. In GridAPPS-D, the visualizations and applications ought to use the best available state estimator outputs, instead of raw SCADA values, for both accuracy and consistency. Therefore, the state estimator is not an application but a service in GridAPPS-D, sitting between emulated SCADA and the GOSS bus.

Figure 1: The state estimator processes noisy and incomplete measurements, then posting estimated voltage (V), current (I), real power (P), reactive power (Q) and switch status (S) values onto the GridAPPS-D message / data bus.
In Figure 1, the power system model (upper left) will include a limited number of sensors, corresponding to actual voltage and current transformers, line post sensors, wireless sensors, etc. In some scenarios, smart meters can also be sensors. Each such sensor will have different performance characteristics (e.g. precision, accuracy, sampling rate). Distribution systems typically do not have enough sensors to make the system observable, so there will be measurement gaps in the topology. The state estimator might fill these gaps with interpolation and graph-tracing methods on the power system model.
The supervisory control and data acquisition (SCADA) system in Figure 1 introduces more errors and failure points. Eventually, GridAPPS-D may simulate these impacts by federating ns-3 as a co-simulator. Until then, a placeholder module could be used to insert variable errors, time delays and dropouts in each measurement, whether due to sensor characteristics or the communication system. The output represents data as it would come into an operations center, and feeds the state estimator. Internally, the data flows between simulator, SCADA and state estimator might be implemented with FNCS, but this is an implementation detail. The state estimator will provide two outputs to the GOSS bus used by all GridAPPS-D applications:
- At a time step configured by the platform, publish the best-estimate VIPQS values wherever sensors actually exist in the model, with quality attributes that still have to be established. Sensor locations delineate circuit segments, and note that all VIPQS values will be estimated at the boundaries, even if the sensor measures only V or I, for example.
- Upon request by another application or service, publish the estimated VIPQS values for all nodes and components in the model, even at locations where no sensors exist. A variant is to publish the estimates only for selected nodes and components.
As indicated in Figure 1, other applications need to obtain estimated VIPQS values from the GOSS bus. Switch open/close states are a special case; they might be considered known values, but in practice the switch state is a measurement, which could lead to topology errors in the model. For GridAPPS-D, switch state estimates need to be a point of emphasis. Given that most distribution systems lack redundant measurements, It would be possible for an application to query these VIPQS values directly from the simulator or SCADA, bypassing the state estimator, but this is “cheating” in most situations. However, in the application development process, idealized VIPQS values could be obtained through a combination of two methods:
- Add more sensors to the power system model
- Set the sensor and channel errors to zero
Because the sensor outputs in GridAPPS-D come from a power flow solution that enforces Kirchhoff’s Laws, the state estimator will produce ideally accurate values whenever the sensor and channel errors have been specified to be zero. The state estimator may still exhibit interpolation errors between sensor locations, but that is readily mitigated for testing purposes by adding more sensors.
With reference to RC1, the visualization and VVO applications should now subscribe to VIPQS values from the state estimator, not from the distribution simulator. They may also use or display quality metrics on the estimated values.
Model Validation Application
The state estimator basically attempts to fit measured data to a power flow model, usually assuming that the model is correct. However, a model attribute (e.g. line impedance) could also be estimated by minimizing its error residual in the state estimator’s power flow solution. This process works best when applied to just one or a few suspect attributes, and/or when an archive is available to provide enough redundant measurements. The Model Validation Application will use these state estimator features off-line to help identify and correct the following types of model errors:
- Unknown or incorrect service transformer sizes
- Unknown or incorrect secondary circuit lengths
- Incorrect phase identification of single-phase components
- Phase wiring errors in line segments and switches
- Transformer connection errors, especially reversed primary and secondary
- Primary conductor sizes that don’t decrease monotonically with distance from the source
- Missing regulator and capacitor control settings (i.e. supply defaults from heuristic rules)
- More than one of these on the same pole: recloser, line regulator, capacitor
- Substation transformer impedance and turns ratio
These types of errors often appear upon the initial model import from a geographic information system (GIS), or in periodic model updates from GIS. Other error types may be added later. Many utilities do not have their secondary circuits modeled at all, but this has an important impact on AMI data. The service transformers and secondary circuits insert significant impedance between AMI meters and the primary circuit, where most of the other sensors are installed. Therefore, the first two items will require AMI data, and also enable its more effective use.
As shown in Figure 2, the Model Validator integrates with GridAPPS-D as a hosted application on the GOSS bus. Internally, it will use some of the same algorithms as the State Estimator and may share some code or binary files, but this is an implementation detail. It will need to access an archive of state-estimated VIPQS data, which may include AMI data. It will also use or incorporate an off-line power flow model, not the same one running in the GridAPPS-D distribution simulator. This may be EPRI’s OpenDSS simulator [3]; compared to GridLAB-D, it’s more tolerant of model errors and provides more diagnostic information about model errors.
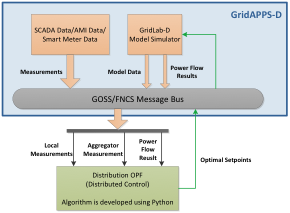
Figure 2: The Model Validator works with an archive from the state estimator, and an off-line power flow model.
Transactive Systems Application
Transactive energy is a method of controlling loads and resources on the distribution system, combining both market and electrical principles [4]. One reason for including this application in DOE-funded GridAPPS-D is that PNNL has made several technical contributions and led several demonstration projects in transactive systems, also funded by DOE. We’ve selected building-to-grid integration as a new topic for utility operations, and this will not overlap with other sample applications. The details of application scope are still to be established in consultation with industry advisors and potential utility hosts. Some candidates or examples would be:
- Integration with transactive campuses at PNNL, University of Washington, Washington State University, Case Western, University of Toledo, and/or NASA Glenn Research Center
- Integration with the micro-transactive grid project at Avista Utilities in Spokane, funded by WA Clean Energy Fund 2
- Integration with a building energy management system (BEMS) in a host utility service area
- Forecasting and management of load and/or resources from a large urban building
- Integration with a smart-home management system, especially one hosted on a smart meter
Specifically for GridAPPS-D, we wish to include VOLTTRON [5] as the basis of a standard that might be federated with CIM, or extensions to CIM. We also wish to leverage existing PNNL tools that simulate buildings and transactive agents over a FNCS bus [6]. Because it proposes to interface with customer-owned systems, this application would require more attention to privacy and cybersecurity issues than some other applications.
References
| [1] |
|
| [2] |
|
| [3] |
|
| [4] | Gridwise Architecture Council. (2017). Transactive Energy. Available: http://www.gridwiseac.org/about/transactive_energy.aspx |
| [5] |
|
| [6] | Pacific Northwest National Laboratory. (2017). Transactive Energy Simulation Platform (TESP). Available: http://tesp.readthedocs.io/en/latest/ |
NREL Applications (Release Cycle 2)
Distribution Optimal Power Flow for Real-Time Setpoint Dispatch
Objectives
This application is designed to address the problem of optimizing the operation of aggregations of heterogeneous energy resources connected to a distribution system. We will focus on real-time optimization method and the power setting points of the distributed energy resources (DERs) will be updated on a second or subsecond timescale to maximize the operational objectives while coping with the variability of ambient conditions and noncontrollable energy assets [1]. In order to avoid massive measurements and overcome the limitation caused by model inaccuracy, this application will be implemented in a distributed manner, and only local measurements and a feedback signal from the substation aggregator are needed to determine the optimal setpoints for each controlled DER unit.
Figure 1 The conceptual framework of distribution OPF for real-time setpoint dispatch.
Figure 1 shows the conceptual framework of this application, and this application is targeting at TRL 3.
Design
Figure 2 describes the overall work flow of the application. Distribution OPF algorithm requires real-time measurements, distribution system model and power flow results, which will be obtained from GridAPPS-D platform through GOSS/FNCS message bus. The optimization problem formulation can be constructed using user-defined cost functions for different controllable devices. Finally the optimal setpoints for controllable devices will be solved based on the feedback information from system measurements. These setpoints will be sent back to GridLab-D grid model to update DER operations. Such a closed-loop control forms the control iteration for the studied time point, and new setpoints for the following time points will be determined in the same manner using the updated model and measurements.
Figure 2 The workflow of real-time setpoint dispatch application and its interaction with GridApps-D.
Data requirements
Message schemas (UML) (Enterprise Architect software) Jeff will help draw the UML diagram.
Testing and Validation
Evaluation metrics of this application:
- Real/reactive power at the substation
- System loss
- Voltages across the entire distribution grid: voltage magnitude, voltage fluctuation, voltage unbalance.
- Legacy control device operations: total control actions of all capacitors and regulators
Scenarios:
- Optimal Dispatch for Distributed PV Systems
- Optimal Dispatch for Distributed PV + Energy Storage
- Etc. (will be added when implementing the application)
Operating/Running
This application will be developed using Python.
References
[1] E. Dall’Anese, A. Bernstein, and A. Simonetto, “Feedback-based Projected-gradient Method for Real-time Optimization of Aggregations of Energy Resources,” IEEE Global Conference on Signal and Information Processing (GlobalSIP), Montreal, Canada, Nov. 2017.